![]()
![]()
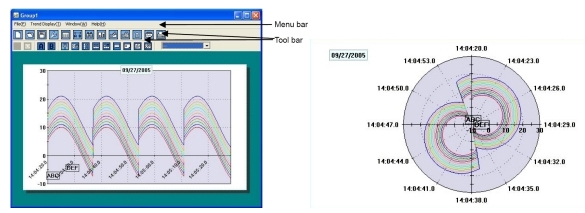
Data analysis software is a software package to analyze the data acquired by the instrument of our company.
| The data acquired by the instrument is displayed as trend. |
| A number of data files can be compiled to one and displayed as a trend. |
| Maximum 372 channels can be registered. Subtraction operations etc can also be registered. |
| Acquired data can be printed, saved in CSV format or text format. |
| Maximum value, minimum value, average value, standard deviation and median value can be displayed numerically and as graph. |
| Two cursors can be displayed in the graph. |
| Maximum value, minimum value, average value, standard deviation and median value between the cursors can be displayed as numeric value and graph. |
| Graph can be magnified, reduced and partially magnified. |
| Message can be inserted in the graph. |
| Scale axis of graph can be logarithmically displayed. |
| Trend graph can be printed. It can be saved as JPG or BMP. |
ZAILA Data Analysis Software